Top stories
November 24, 2023
Guest blogger Philip Totaro - founder and CEO of Totaro & Associates - shares his thoughts on how firms can develop their project portfolios to improve their profit margins.
Guest blogger Philip Totaro - founder and CEO of Totaro & Associates - shares his thoughts on how firms can develop their project portfolios to improve their profit margins.

With more than 7GW added in 2017, the United States wind energy market is seeing robust growth. Vestas has maintained its leadership position in annual capacity additions with 2.5GW, while General Electric stays a close second at 2GW. Siemens Gamesa Renewable Energy had a noteworthy uptick in capacity additions to 1.6GW and Nordex / Acciona comes in fourth at 0.8GW.
But digging deeper for the reasons why Vestas, GE and SGRE have largely dominated the US wind energy market unveils some clear patterns and surprising trends. A key factor that has enabled the success of these three OEMs [original equipment manufacturers] is the diversity of their product portfolio to serve almost any power density. Nevertheless, GE and SGRE have struggled with profitability, so why isn’t the increased sales volume translating?
The answer is return on capital. With so many in the industry focused on reducing the levelized cost of energy across their product portfolio, they have failed to implement their product strategy in a way that maximizes global product sales for a specific turbine model to offset the capital expenditure investment required in the development of that model.
A contributing factor to this poor return on capital, as well as the significant amount of under-exploitation of some wind regimes in the US market, stems from historical patterns in product development and capacity build-out by developers.
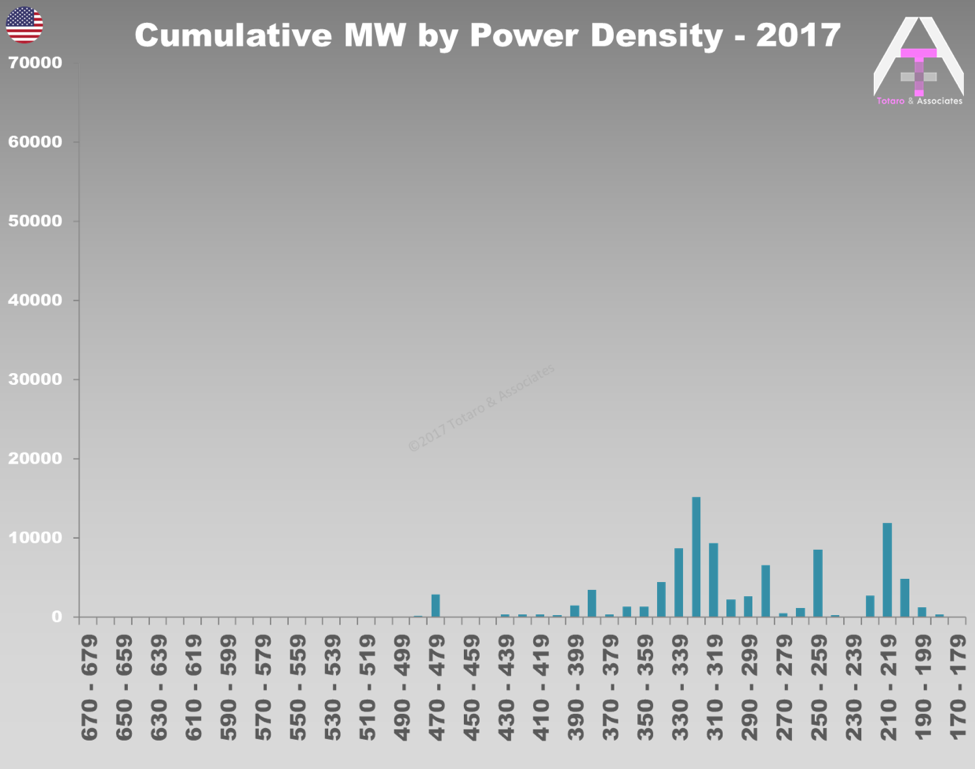
When evaluating the market based on power density of the turbines (i.e. power rating of turbine / swept area of rotor), we see an interesting trend emerge, where capacity additions are largely concentrated around turbines with standard IEC [International Electrotechnical Commission] wind class distribution (see graph 1, below).
But when the market resource potential is overlaid on this installed base distribution, another interesting trend emerges (see graph 2, below).
Specific segments of the market are seeing saturation with multiple OEMs competing fiercely for market share with overlapping turbines in the same power density range. In other market segments, such as a power density range of 230 - 239 W/m2, the US market is seeing little to no capacity penetration whatsoever up through 2017.

The reason for this is that project developers have historically favoured the wind regimes with the best proximity to transmission as well as the availability and scale of turbines, which were aligned with IEC wind class sites. This has ensured maximum payback on project sites in the past, but it has left a significant portion of the US wind resource to see little deployment (see graph 3, below).

While the product portfolios of the top three OEMs in the US have centered around standard IEC wind class products, GE, SGRE and Vestas have also seen a broader diversity of sales thanks to ancillary products that lie in between conventional wind classes.
As a result, some OEMs have taken note of this development pattern, and created a robust product portfolio that can be offered in any market segment regionally and globally. Combined with modular turbine technology architecture, they are seeing better production economies of scale with their product portfolios.
But will that answer the return on capital question? Not entirely. To see this, let’s look at the mapping of the Vestas product portfolio to the US market vs. a smaller competitor like Suzlon.
Overlaying the Vestas product portfolio on the US market resource map highlights this trend towards greater product portfolio diversity. Vestas has developed a ‘product for all seasons’ strategy with a wind turbine in either the 2.X, 3.X or 4.X MW range to serve almost the entire US market (see graph 4, below).

By contrast, Suzlon has a product portfolio that has some potential to capture additional market share, but they have not focused on development of products to capture share in traditional IEC wind class ranges. This is a result of bringing a product designed for the market in India to the US and hoping it will sell, rather than a dedicated product portfolio that has global appeal and diversity, like Vestas (see graph 6, below).

Looking at GE and SGRE, they have product portfolios that are strikingly similar to Vestas with a comparable level of diversity, but with one exception, less profitability on their sales. Why?
Since 2011, Vestas has developed a product portfolio based on product families, rather than a diverse array of individual wind turbines serving individual regional markets. These product families share the same rotor, a similar gearbox, a similar or the same generator, the same tower internals, etc. in an effort to minimize variation throughout the product portfolio and drive supply chain efficiencies with scale.
Additionally, blade capex investment per turbine model can be justified due to wider market specific sales or global sales through export from a primary market versus the development of a market specific turbine in every region of the world.
GE and SGRE also have a wide array of products, but their return on capital has been far less than Vestas due to a later adoption of the modular platform architecture. GE currently has 15 different rotor sizes for turbine nameplate power ratings of 1.7 – 4.8MW.
With capex investment per turbine model of each family between US$30m–$80m, this implies there is a minimum threshold of product sales for each turbine model for which that capex investment breaks even. On some products, GE has not seen the production volumes necessary to break even, while on others they have. In aggregate, sales across the product portfolio have not equaled the capex investment associated with such a diverse product range.
One reason for this is the cannibalization of turbine sales for models that serve the same segment of the market, such as the GE 1.79-100, 2.0-107, 2.4-116 and 2.5-120 (see table, below). Having four product models with different power ratings and rotor sizes does give the project developer more choice, but if all four products could be sold, and only one model is sold for a given project site, then the return on capital for the other three products is diminished because production volumes on that model are lower.

For many wind turbine OEMs, including those who are already well entrenched, they can enhance shareholder value by focusing on the development of a product portfolio that optimizes return on capital as much as it optimizes LCOE.
Next steps on product portfolio development by larger OEMs as well as up and coming OEMs in the US market such as Nordex / Acciona, Senvion and Goldwind will have a profound impact on the future growth and profitability.
